Wednesday, May 26, 2010

Clip Organizer


The Clip Organizer is a tool useful in Microsoft PowerPoint, when users want to insert preset media into their Slide Presentation. Data is categorized into audio, pictures, or videos, and makes it easier for users to find these files, instead of having to perform long searches for them on a computer.

Exit Effect


The Exit Effect is a custom effect that users can apply to a PowerPoint Presentation, for the closure of their presentation. This effect is added on the last slide, and can involve audio such as clapping, the screen fading, or etc.

Placeholders


Placeholders are small boxes found in the slides of the presentation program Microsoft PowerPoint. The purpose of the Placeholders is so that text and titles can remain in place, and in a certain spot of the slide layout.

Presentations


In Microsoft PowerPoint, a presentation is a display of data and text in the form of a slide show. Each slide has its own unique background, color, data, font, graphics, and effects such as a transition. Once a group of slides have been created and edited to match a corresponding topic, a Presentation has been created and is ready for display.

Slide Design


The Slide Design is the default slide used for a PowerPoint presentation after a master slide has been placed. The Master slide includes the graphics, background, and fonts that will be used, and this slide design can be repeated with all other slides that follow the Master Slide.

Slide Finder

There are many circumstances in which a PowerPoint user is found in a situation where they need to reuse a specific slide. Thanks to the PowerPoint finder tool in Microsoft PowerPoint, users can save a copy of their desired slide, and the Finder will locate it, allowing that slide to be reused over and over.

Slide Layout


In a PowerPoint presentation, users can have a background for their Slide text, they can have it in a specific arrangement, with a text size or font, and graphics. This is known as the slide Layout.

Slide Master


The Slide Master is the process which creates slides and layouts by arranging and creating the fonts, colors, and graphics. The Slide Master can be accessed in any case that the users would like to make changes to the layout for all slides, or just an independent slide.

Slide Show View


Once you have completed a PowerPoint presentation, or you just want a preview of a current slide, you can access the Slide Show Viewer. The Slide Show Viewer is a feature that allows you to view the effects such as sound effects, animations, transitions, and any other customization that you have made for your presentation.

Slide Sorter View


In Microsoft PowerPoint the Slide Sorter View is a feature in which miniature versions of all PowerPoint slides are presented side by side. You can click on any of these slides so that you can see it in normal view, or you can change the arrangement and order of your slides.

Transitions


Microsoft PowerPoint has a presentation feature known as a transition. A transition is a visual movement used to switch from one slide to another.

Tuesday, May 25, 2010

Gantt Charts

A Gantt Chart is just one in many charts that computer users can create using the program Microsoft Excel. This chart comes in very useful when users want to present an arrangement of data such as the performance of several tasks over time. Gantt Charts can be created once users have data that includes a Start Date, numerical data for Completion, and numerical data that is Remaining. Then, by using the chart wizard, you have to create a stacked bar chart, format the axis, and when formatting the x axis, you have to right click on the axis, format the series and click on the option that says Values in Reverse Order. Users can remove fill and border color, display axis labels at their own custom angles, and then edit the legend if you want it to appear on a specific side of the chart.

Monday, May 17, 2010

Absolute Cell Reference

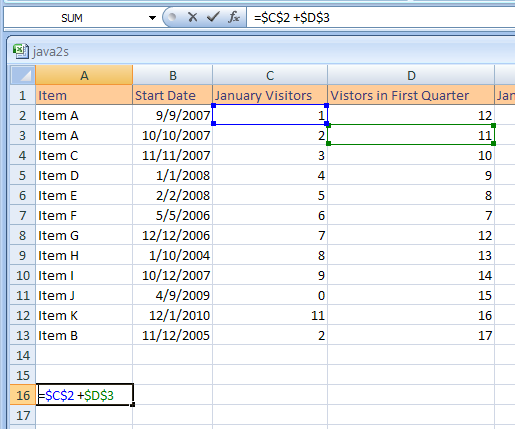
An Absolute Reference, is a cell Reference that no matter where you move, what you copy, paste, or delete, the reference made will always be to the same particular cell.

Argument


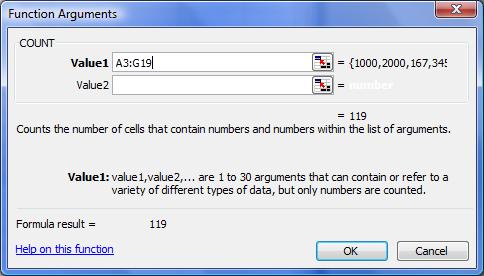
Arguments are very important in Microsoft Excel, especially when using functions. Arguments is the name given to the data inside the parenthesis. This data is later evaluated and solved by a Function Formula.

Charts


Charts are not only found in the math class, but also in Microsoft Excel. They allow users to create and publish spreadsheet and worksheet presentations, with better visuals, also useful for those that do not understand how data is arranged in Microsoft Excel. The available charts in Excel include Pie Charts, Line Graphs, Bar Charts, and Column Charts. All these charts can also be referred to as graphs.

Sunday, May 16, 2010

Embedded Chart

An Embedded Chart in Microsoft Word is made when you create a chart, on data already in a worksheet. You enter the data, and then you can chose whatever format you want for the chart that it well be embedded in, hence the name "an Embedded Chart".

Function Formula


A Function Formula, is a preset formula for Microsoft Excel used for problem solving. Function Formulas begin with the equal sign (=), and are then followed by the numbers used. Functions then tell excel what method to use to solve.

Saturday, May 15, 2010

Mathematical Functions

Mathematical Functions are used in Microsoft Excel to perform different mathematical functions such as finding the absolute value of a number (ABS), to multiply (PRODUCT) and to do much more. The complete set of Mathematical Functions include:
FunctionDescription
ABSReturns the absolute value of a number.
ACOSReturns the arccosine of a number
ACOSHReturns the inverse hyperbolic cosine of a number
ASINReturns the arcsine of a number
ASINHReturns the inverse hyperbolic sine of a number
ATANReturns the arctangent of a number
ATAN2Returns the arctangent from x- and y-coordinates
ATANHReturns the inverse hyperbolic tangent of a number
CEILINGRounds a number to the nearest integer or to the nearest multiple of significance
COMBINReturns the number of combinations for a given number of objects
COSReturns the cosine of a number
COSHReturns the hyperbolic cosine of a number
DEGREESConverts radians to degrees
EVENRounds a number up to the nearest even integer
EXPReturns e raised to the power of a given number
FACTReturns the factorial of a number
FACTDOUBLEReturns the double factorial of a number
FLOORRounds a number down, toward zero
GCDReturns the greatest common divisor
INTRounds a number down to the nearest integer
LCMReturns the least common multiple
LNReturns the natural logarithm of a number
LOGReturns the logarithm of a number to a specified base
LOG10Returns the base-10 logarithm of a number
MDETERMReturns the matrix determinant of an array
MINVERSEReturns the matrix inverse of an array
MMULTReturns the matrix product of two arrays
MODReturns the remainder from division
MROUNDReturns a number rounded to the desired multiple
LinkMULTINOMIALReturns the multinomial of a set of numbers
ODDRounds a number up to the nearest odd integer
PIReturns the value of pi
POWERReturns the result of a number raised to a power
PRODUCTMultiplies its arguments
QUOTIENTReturns the integer portion of a division
RADIANSConverts degrees to radians
RANDReturns a random number between 0 and 1
RANDBETWEENReturns a random number between the numbers you specify
ROMANConverts an arabic numeral to roman, as text
ROUNDRounds a number to a specified number of digits
ROUNDDOWNRounds a number down, toward zero
ROUNDUPRounds a number up, away from zero
SERIESSUMReturns the sum of a power series based on the formula
SIGNReturns the sign of a number
SINReturns the sine of the given angle
SINHReturns the hyperbolic sine of a number
SQRTReturns a positive square root
SQRTPIReturns the square root of (number * pi)
SUBTOTALReturns a subtotal in a list or database
SUMAdds its arguments
SUMIFAdds the cells specified by a given criteria
SUMPRODUCTReturns the sum of the products of corresponding array components
SUMSQReturns the sum of the squares of the arguments
SUMX2MY2Returns the sum of the difference of squares of corresponding values in two arrays
SUMX2PY2Returns the sum of the sum of squares of corresponding values in two arrays
SUMXMY2Returns the sum of squares of differences of corresponding values in two arrays
TANReturns the tangent of a number
TANHReturns the hyperbolic tangent of a number
TRUNCTruncates a number to an integer

Mixed Cell Reference


A Mixed Cell Reference is a combination of either an Absolute Row and Relative Column, or an Absolute Column and Relative Row. In order to create an Absolute Row or an Absolute Column, you need to add $ before the column letter or row letter that you want to use.

Operand


When users want to solve a formula, equation, etc., in Microsoft Excel, they must first enter the values and data that they want to use. This data is identified as the Operands, and is important because the Operators in Excel need this data to proceed with a solving process.