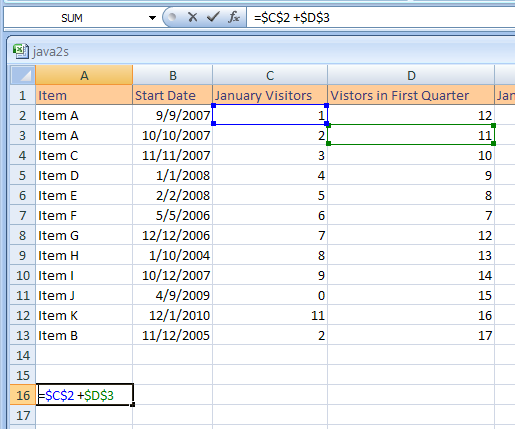
 An Absolute Reference, is a cell Reference that no matter where you move, what you copy, paste, or delete, the reference made will always be to the same particular cell.
Showing posts with label Microsoft Excel. Show all posts
Showing posts with label Microsoft Excel. Show all posts
Monday, May 17, 2010
Absolute Cell Reference
An Absolute Reference, is a cell Reference that no matter where you move, what you copy, paste, or delete, the reference made will always be to the same particular cell.
Argument
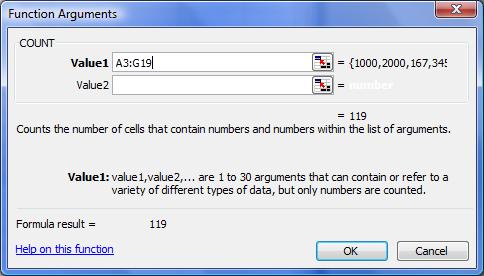
Arguments are very important in Microsoft Excel, especially when using functions. Arguments is the name given to the data inside the parenthesis. This data is later evaluated and solved by a Function Formula.
Charts

Charts are not only found in the math class, but also in Microsoft Excel. They allow users to create and publish spreadsheet and worksheet presentations, with better visuals, also useful for those that do not understand how data is arranged in Microsoft Excel. The available charts in Excel include Pie Charts, Line Graphs, Bar Charts, and Column Charts. All these charts can also be referred to as graphs.
Sunday, May 16, 2010
Embedded Chart
 An Embedded Chart in Microsoft Word is made when you create a chart, on data already in a worksheet. You enter the data, and then you can chose whatever format you want for the chart that it well be embedded in, hence the name "an Embedded Chart".
Function Formula

A Function Formula, is a preset formula for Microsoft Excel used for problem solving. Function Formulas begin with the equal sign (=), and are then followed by the numbers used. Functions then tell excel what method to use to solve.
Saturday, May 15, 2010
Mathematical Functions
Mathematical Functions are used in Microsoft Excel to perform different mathematical functions such as finding the absolute value of a number (ABS), to multiply (PRODUCT) and to do much more. The complete set of Mathematical Functions include:
| Function | Description |
|---|---|
| ABS | Returns the absolute value of a number. |
| ACOS | Returns the arccosine of a number |
| ACOSH | Returns the inverse hyperbolic cosine of a number |
| ASIN | Returns the arcsine of a number |
| ASINH | Returns the inverse hyperbolic sine of a number |
| ATAN | Returns the arctangent of a number |
| ATAN2 | Returns the arctangent from x- and y-coordinates |
| ATANH | Returns the inverse hyperbolic tangent of a number |
| CEILING | Rounds a number to the nearest integer or to the nearest multiple of significance |
| COMBIN | Returns the number of combinations for a given number of objects |
| COS | Returns the cosine of a number |
| COSH | Returns the hyperbolic cosine of a number |
| DEGREES | Converts radians to degrees |
| EVEN | Rounds a number up to the nearest even integer |
| EXP | Returns e raised to the power of a given number |
| FACT | Returns the factorial of a number |
| FACTDOUBLE | Returns the double factorial of a number |
| FLOOR | Rounds a number down, toward zero |
| GCD | Returns the greatest common divisor |
| INT | Rounds a number down to the nearest integer |
| LCM | Returns the least common multiple |
| LN | Returns the natural logarithm of a number |
| LOG | Returns the logarithm of a number to a specified base |
| LOG10 | Returns the base-10 logarithm of a number |
| MDETERM | Returns the matrix determinant of an array |
| MINVERSE | Returns the matrix inverse of an array |
| MMULT | Returns the matrix product of two arrays |
| MOD | Returns the remainder from division |
| MROUND | Returns a number rounded to the desired multiple |
 MULTINOMIAL MULTINOMIAL | Returns the multinomial of a set of numbers |
| ODD | Rounds a number up to the nearest odd integer |
| PI | Returns the value of pi |
| POWER | Returns the result of a number raised to a power |
| PRODUCT | Multiplies its arguments |
| QUOTIENT | Returns the integer portion of a division |
| RADIANS | Converts degrees to radians |
| RAND | Returns a random number between 0 and 1 |
| RANDBETWEEN | Returns a random number between the numbers you specify |
| ROMAN | Converts an arabic numeral to roman, as text |
| ROUND | Rounds a number to a specified number of digits |
| ROUNDDOWN | Rounds a number down, toward zero |
| ROUNDUP | Rounds a number up, away from zero |
| SERIESSUM | Returns the sum of a power series based on the formula |
| SIGN | Returns the sign of a number |
| SIN | Returns the sine of the given angle |
| SINH | Returns the hyperbolic sine of a number |
| SQRT | Returns a positive square root |
| SQRTPI | Returns the square root of (number * pi) |
| SUBTOTAL | Returns a subtotal in a list or database |
| SUM | Adds its arguments |
| SUMIF | Adds the cells specified by a given criteria |
| SUMPRODUCT | Returns the sum of the products of corresponding array components |
| SUMSQ | Returns the sum of the squares of the arguments |
| SUMX2MY2 | Returns the sum of the difference of squares of corresponding values in two arrays |
| SUMX2PY2 | Returns the sum of the sum of squares of corresponding values in two arrays |
| SUMXMY2 | Returns the sum of squares of differences of corresponding values in two arrays |
| TAN | Returns the tangent of a number |
| TANH | Returns the hyperbolic tangent of a number |
| TRUNC | Truncates a number to an integer |
Mixed Cell Reference

A Mixed Cell Reference is a combination of either an Absolute Row and Relative Column, or an Absolute Column and Relative Row. In order to create an Absolute Row or an Absolute Column, you need to add $ before the column letter or row letter that you want to use.
Operand

When users want to solve a formula, equation, etc., in Microsoft Excel, they must first enter the values and data that they want to use. This data is identified as the Operands, and is important because the Operators in Excel need this data to proceed with a solving process.
Operator
 Microsoft Excel is a program that will work out formulas and solutions by using Operators. These "Operators" are the decision makers of the solving process, because they decide what type of operation will be used to proceed and solve a process. The four main types of operators include Arithmetic, Comparison, Text, and Reference.
Order of Evaluation

When making evaluations, Microsoft Excel enters a process known as the Order of Evaluation. The Order of Evaluation is a multi-step process that includes Exponentiation, Multiplication and Division, and Addition and Subtraction depending on what it is that Excel will be evaluating. For example, when formulas both contain Multiplication and Addition, the operation will be performed from left to right.
Relative Cell References
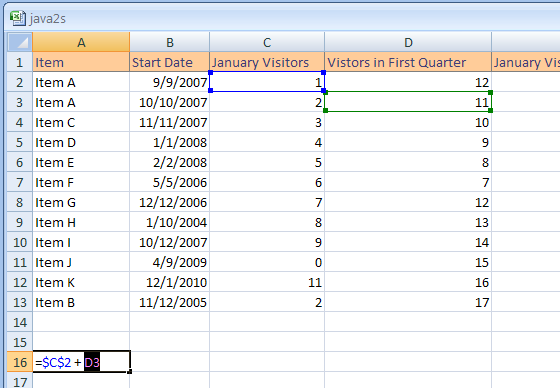
Relative Cell References is a feature in Microsoft Excel in which reference is made to either a cell or group of cells, by how far away it is from another cell. When you are making a reference from a Cell like C2, which is three columns and two rows down from A1, the cell reference made by the program is 2 columns right, and 1 row down.
Thursday, May 13, 2010
Statistical Functions

Microsoft Excel is preset with Functions such as Math Functions, Text Functions, Financial Functions, and etc. One of these functions is a Statistical Function. Statistical Functions are used to analyze data in a spreadsheet by telling you the numerical average of data, or the quantity of data in the spreadsheet.
Monday, May 10, 2010
Active Cell

When you are entering textual data in a cell or format a cell, a black border appears as the cell. The purpose of this cell being shaded is because it is the cell that is currently in use, which is known as the active cell.
Ascending Order

In Microsoft Excel, an Ascending Order is an arrangement of data, specifically numerical values. This numerical data is arranged in an increasing order, where the smallest value of data is entered, and begins to increase. It can also be in alphabetical value, where data begins from the letter a, and advances to z or the desired end letter.
Cell Reference
In Microsoft Excel, a Cell Reference is when one cell in particular is taken, and date applied to any other cells relate/refer to that one particular cell. In other words, Cell Reference is when one cell is used as the foundation or base for the data in a spreadsheet/worksheet/workbook.
Descending Order

In Microsoft Excel, Data can be arranged and rearranged in a Descending Order. Unlike the Ascending order, in a Descending Order, data is arranged from the largest value such as a numerical value, to the smallest value.
Fill Handle

Once a cell is selected and serves as the Active Cell, a small square appears at the bottom of the shaded area. This is known as the fill Handle. Fill Handles can be used to adjust cell properties, add data, and expand cell sizes. Once certain data is placed in a cell, Fill Handles can automatically place similar data in the following cells.
Filling Gridlines
 In Microsoft Excel, Gridlines are lines that define the sides of cells, columns, and rows. Depending on the size and quantity of text and data, Gridlines automatically adjust themselves, and users are allowed to customize Gridlines with filling effects such as the shade or background color.
Header Row

Just like in Microsoft Word, The Header Row is an option accessible by users, and when created, it is always found at the top of Microsoft. The Header Row serves a purpose for being the title of different data organized in different cells and columns.
Sunday, May 9, 2010
Merge Range

In Microsoft Excel, users have the ability to merge/combine multiple cells together, in either rows or columns. The Merge Range is the limit of how many cells can be merged, and in Excel, users can merge a whole page of cells together if they want to just display one certain type of data.
Subscribe to:
Posts (Atom)

